|
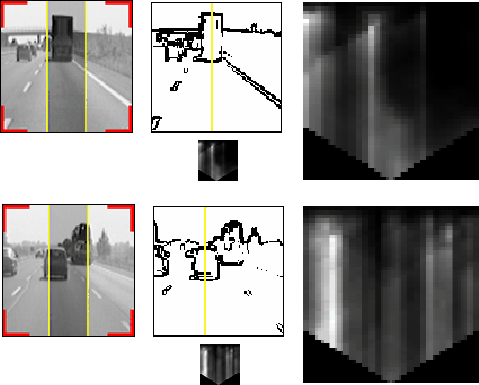
In order to search for symmetrical features, the analysis of gray level images is not sufficient. Figure 11 shows that strong reflections cause irregularities in vehicle symmetry, while uniform areas and background patterns present highly correlated symmetries. In order to get rid of these problems, also symmetries in other domains are computed. 
Figure 11: Typical road scenes: in the first a strong sun reflection weakenes the vehicle gray level symmetry; in the second a uniform area can be seen as a highly symmetrical region; the third shows background symmetrical patterns. To get rid of reflections and uniform areas, vertical and horizontal edges are extracted and thresholded, and symmetries are computed into these domains as well. Figure 12 shows that although a strong reflection is present on the left side of the vehicle, edges are anyway visible and can be used to extract eymmetries; moreover, in uniform areas no edges are extracted and therefore no symmetries can be detected. 
Figure 12: Edges enforce the detection of real symmetries: strong reflections have lower effects while uniform areas are discarded since they do not present edges. Figure 16 shows two examples in which gray level symmetries can be successful for vehicle detection, while figure 17 shows the result of edge symmetry. For each image, the search area is shown in dark gray and the resulting vertical axis is superimposed. For each image its symmetry map is also depicted both in its origianl size and -on the right- zoomed for better viewing. White points encode the presence of high symmetries. The 2D symmetry maps are computed by varying the axis' horizontal position within the grey area (shown in the original image) and the symmetry horizontal size. The lower triangular shape is due to the limitation in scanning large horizontal windows for peripheral vertical axes. 
Figure 16: Grey level symmetries.

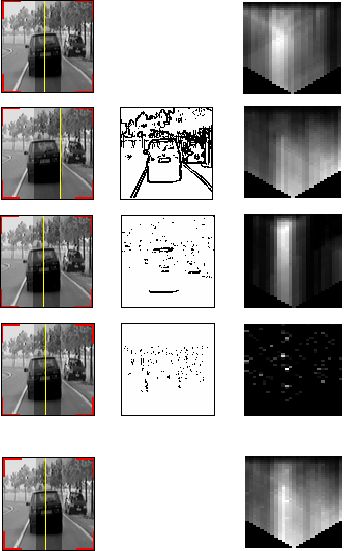
Figure 17: Edge symmetries. Similarly, the analysys of symmetries of horizontal and vertical edges produces other symmetry maps, which -with specific coefficients detected esperimentally- can be combined with the previous ones to form a single symmetry map. Figure 28 shows all symmetry maps and the final one, that allows to detect the vehicle. 
Figure 28: Computing resulting symmetry: (a) grey-level symmetry; (b) edge symmetry; (c) horizontal edges symmetry; (d) vertical edges symmetry; (e) total symmetry.
|